
Get the free template here: https://datastudio.google.com/u/0/reporting/adc7bf71-f134-429c-ade8-ac992cef7f96/page/TV1FB/preview
Looking for a report template for small clients? We’ve got a video, template, instructions, and a bonus internal dashboard – just for you.
In our (free) Facebook group, I got a request for a report template for small businesses:
We deal with very small business (like 500 a month budgets are big time here). so its about clearly laying out performance metrics without then having to have a 6 hour call to explain them.
I asked for a few more details, and here’s what I got:
Honestly just looking for what you would pull out of your hat for a regular mum and pop small business who is looking for contact form leads.
Most of the time they have a small budget for Google ads so my normal metrics are total clicks. Total cost. Contact forms completed. Cost per form. CTR.
This gave me enough constraints that I could create a focused report that could be modified for any small business. Challenge accepted!
I polled the group for more inputs and requests, then got to work building out a template using Google Ads sample data.
Objective:
Create a Google Ads reporting template in Data Studio that would be appropriate for a “mom and pop” client with <$500/mo ad spend.
Audience:
- Small business owners tend to be the final decision makers, no additional approval is likely to be needed to implement changes.
- Needs KPIs and high-level performance metrics (spend, conversions, etc).
- Needs to clearly understand “why” behind recommendations before taking action.
- Wants more insights.
Challenges:
- Most clients in this segment have a limited knowledge of metrics and marketing, but have a strong desire to “feel” informed (see: “just enough to be dangerous”)
- Too much info (or too many pages) will lead to cognitive overwhelm
- Too few visualizations will drive dissatisfaction and FOMO (“we want hidden insights! What’s happening that we don’t already know?”)
Solution:
- Create a hybrid report that includes room for written explanation, so clients aren’t expected to memorize acronyms or recognize the importance of metrics un-aided.
- Visually prioritize key metrics and trends.
- Satisfy clients’ desire for deeper data by including visualizations that are interesting to clients, even if not actionable.
- Avoid details and metrics that are likely to unnecessarily drive inspection or critique without contributing to the larger conversation of business growth. (Examples of this include daily performance trends, cost sorting, impression data, etc).
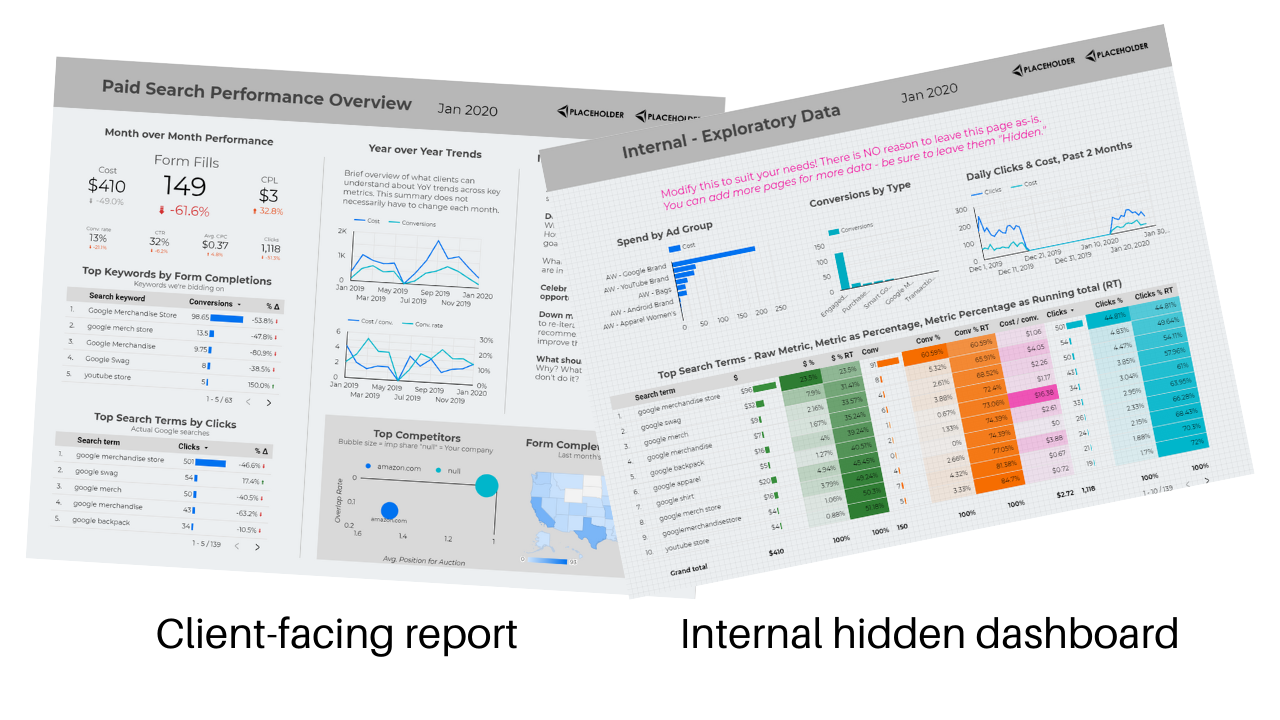
Report Template Components
- Report-level header: background bar, auto-updated month and year, placeholders for client and company logos
- Month over Month section: KPI and key metrics, top keywords and search terms
- Year over Year section: High level trends and 13 month lookback charts
- Insights & Recommendations: Analysis, opportunities & stakes
- Shiny Charts: Added visualizations that are easy
- (Hidden Section) Internal Dashboard: Track, visualize and and explore data
How to Setup the Template:
- Click “use template” from this Data Studio report
- Replace Data Source (instructions)
- Replace “placeholder” logos with logos for your client and your company.
- Replace & update text throughout
- Edit any charts or settings to reflect your KPIs and key observations
- Share the report with clients via PDF or report access (instructions)
How to Use the Template:
Do not expect to “set and forget” this one – Your clients rely on you for marketing expertise; they’re not going to find it on their own just by reviewing last month’s data points.
After the data automatically refreshes at the beginning of the month, open the report and update the text with your insights and recommendations.
The insights you need to provide your clients with a solid understanding of performance will not be extracted from this report alone – you’ll need to dig into your account and external sources for answers. This is what the internal dashboard is for.
Client delivery: Because the report automatically refreshes each month, last month’s data will be “overwritten.” We recommend providing your clients with a PDF version so they can retain a copy of the data and analysis.
Remember – templates don’t have to be “set it and forget it,” and good reporting is rarely plug-and-play. I hope this template helps get you thinking on what you want to automate and what should be updated manually.
We’re working on a course! Get notified when we take Storytelling with Google Data Studio live!
Thanks to Google Ads for Savvy Digital Marketers for inspiring the creation of this template and many of its features, and to Periscopix for inspiring the Auction Insights scatter plot.