
If you’re just getting started in Google Data Studio, you may have noticed you can’t do ANYTHING in it until you have a data source. It’s literally a blank page with no options or functionality:
![]()
Once you connect to a data source, it’s a different story:
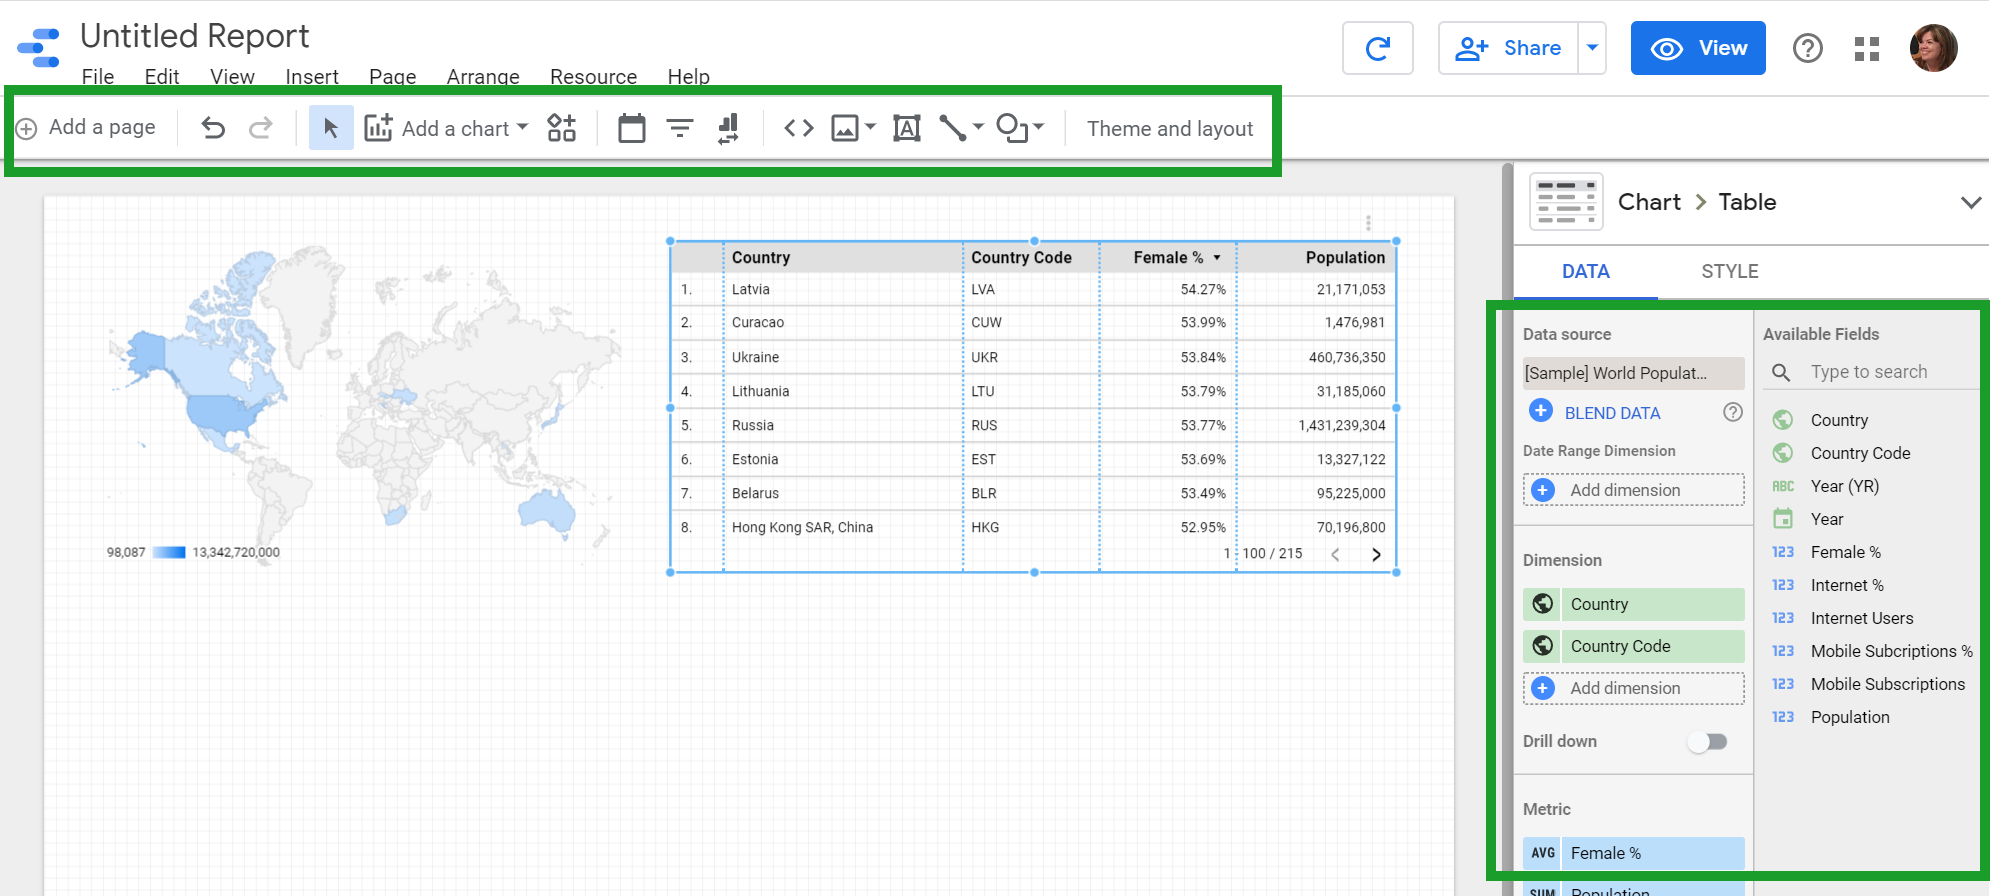
Here’s a quick overview of 2 ways to get data into your report.
Data Source Option #1: Use Sample Data
Data Studio comes loaded with sample data sources, such as World population data, Google Analytics, Search Console, Google Ads and YouTube:
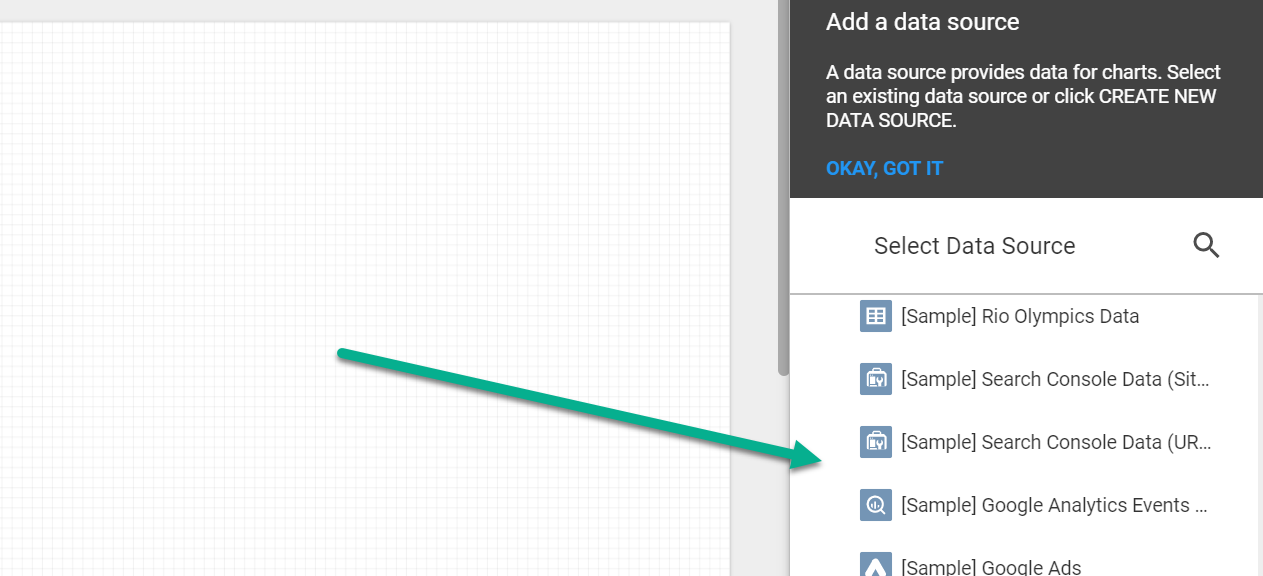
Sample data is great for exploring and experimenting with charts and visualizations.
Once you select the source, you can start playing with metrics and dimensions to see data studio in action.
Data Source Option #2: Use Your Own Data
The fact is, you probably have your own data that we need to report on, so that brings us to option #2 – connecting your own data.
Once you’ve gone through the process of connecting your data source, you’ll see it in your list of available sources (along with sample data) going forward. You only need to “create” it once.
What Data can be Connected
Before we jump into HOW to connect your data, let’s quickly look at WHICH data you can connect.
Many Google products (like Analytics and Ads, though frustratingly not Trends) connect directly with a connector built by Data Studio.
Other platforms, like Facebook, aren’t native to Data Studio and will need a 3rd-party connector (such as Supermetrics).
You can use work-arounds (like uploading a file, or exporting data to Google Sheets and then connecting Google Sheets) to access your data in your report.
You’ll get a better idea for all your options as you walk through the process of connecting, so let’s continue.
Create your Data Source
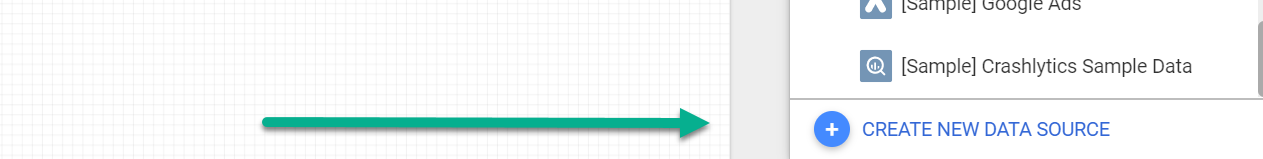
If you haven’t connected your data source yet, you’ll find that option at the bottom of the list of data sources:
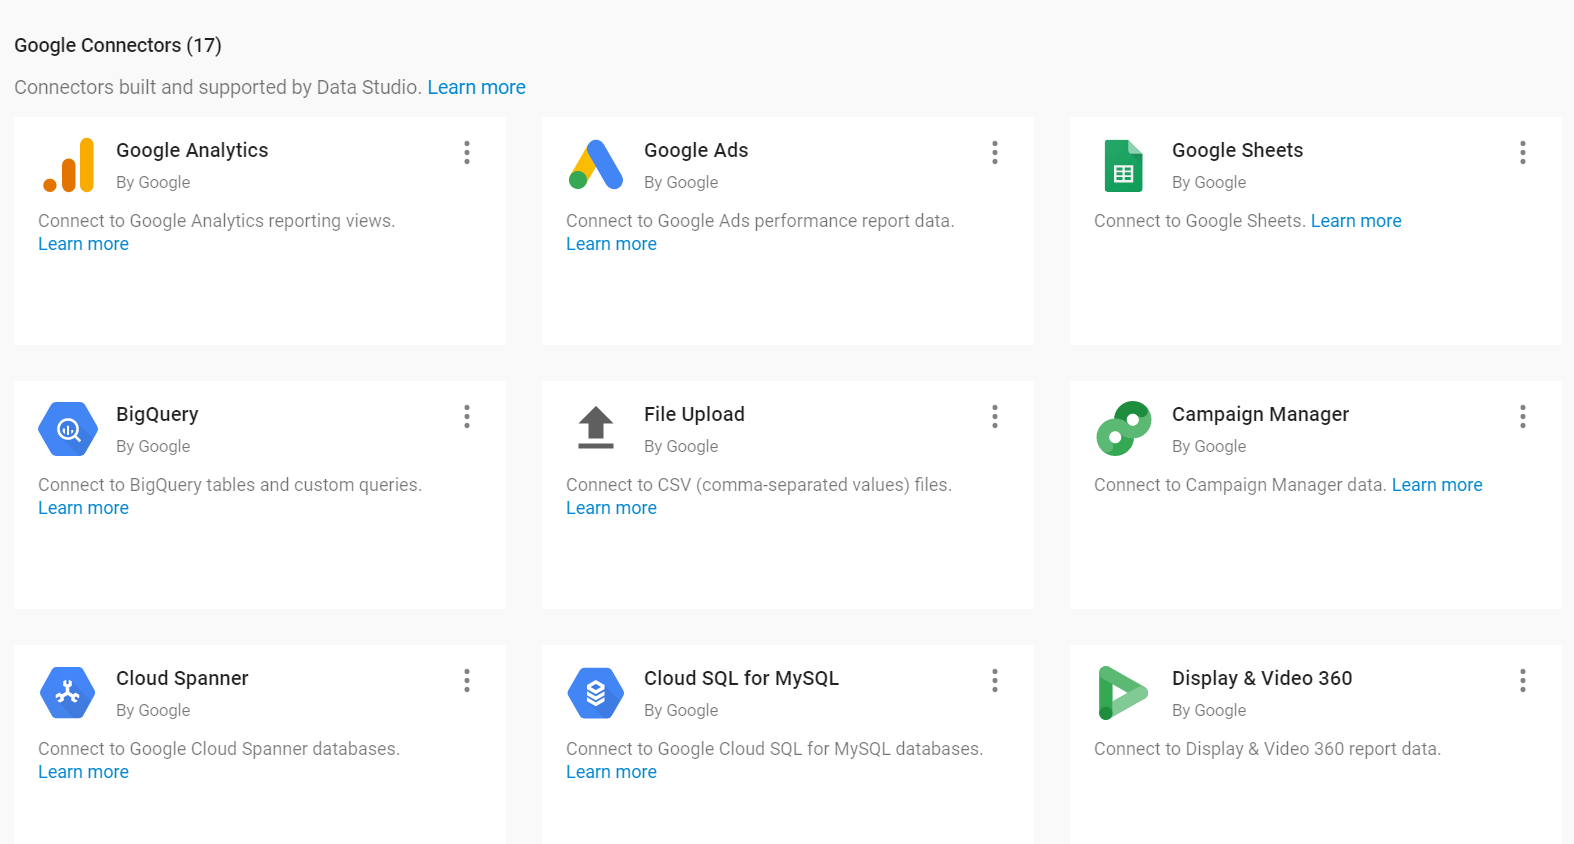
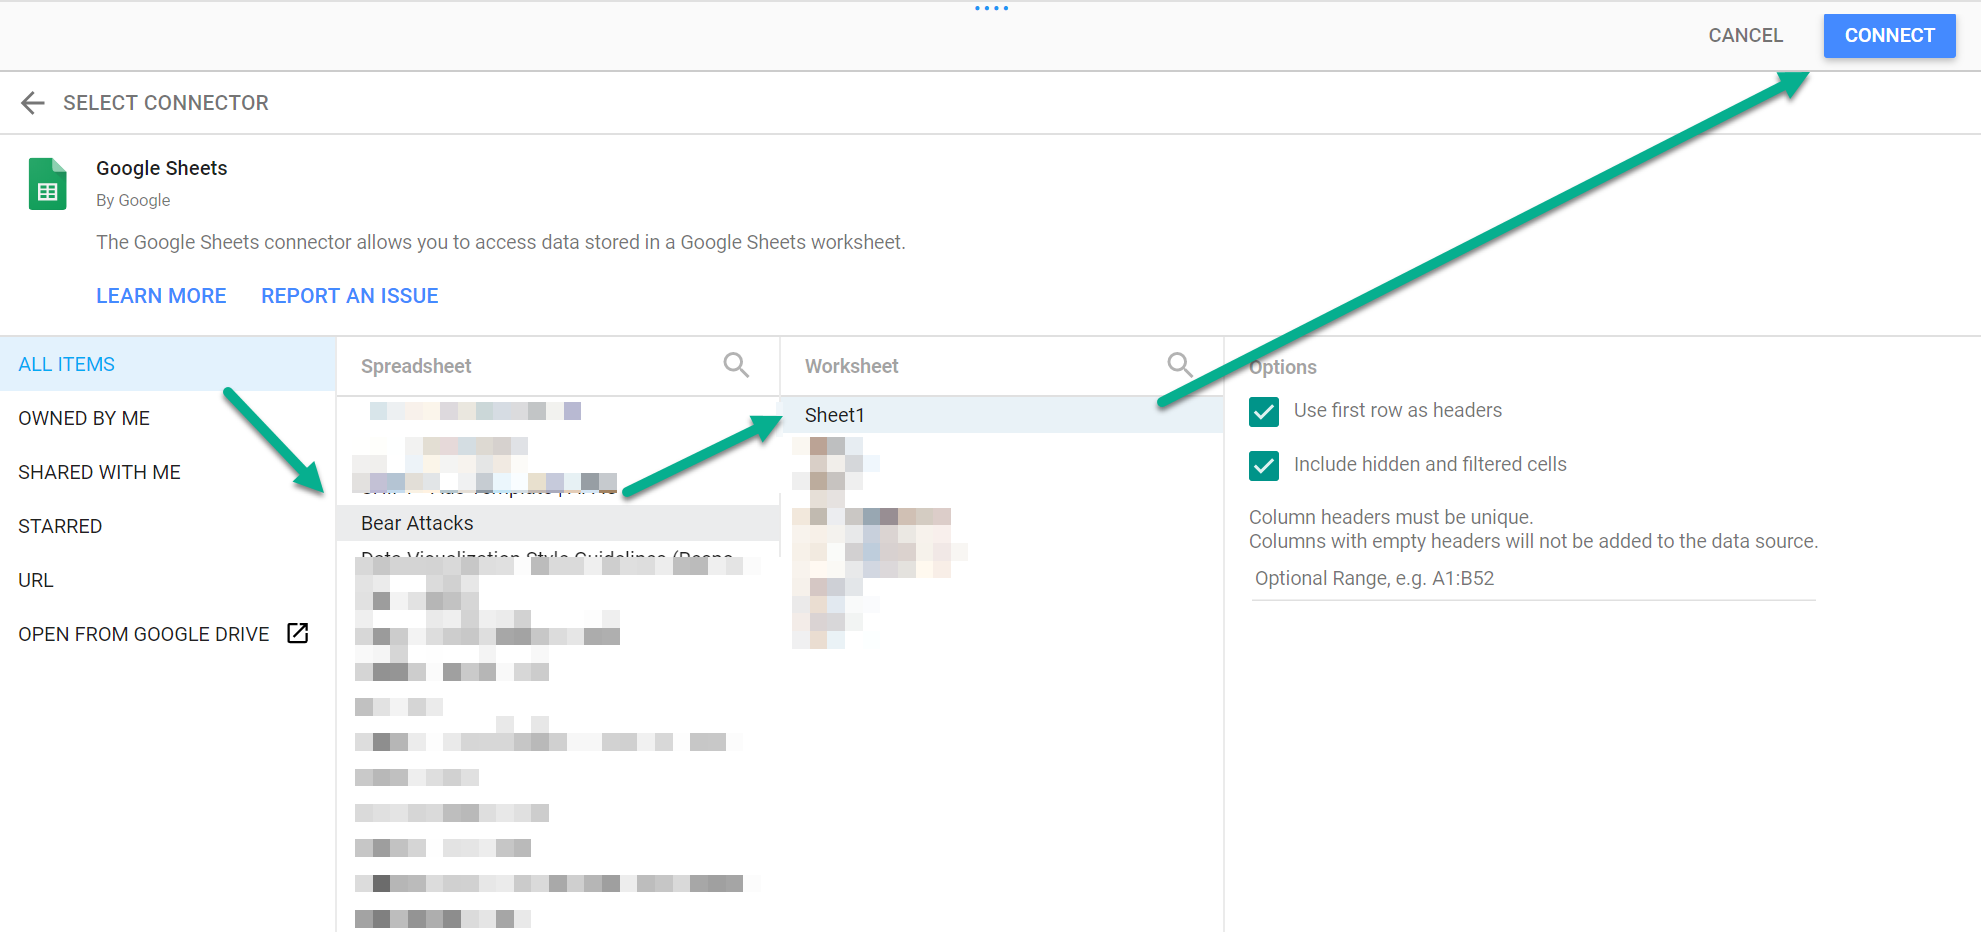
From there, you’ll see a master list of connectors. If you aren’t sure which connector to use, just click “learn more” to explore your options. Select the connector that will work for your data.
Adding a data source is pretty simple, but the buttons are weirdly in the top right of the page.
Using Google Sheets? You’ll need to add each worksheet one at a time.
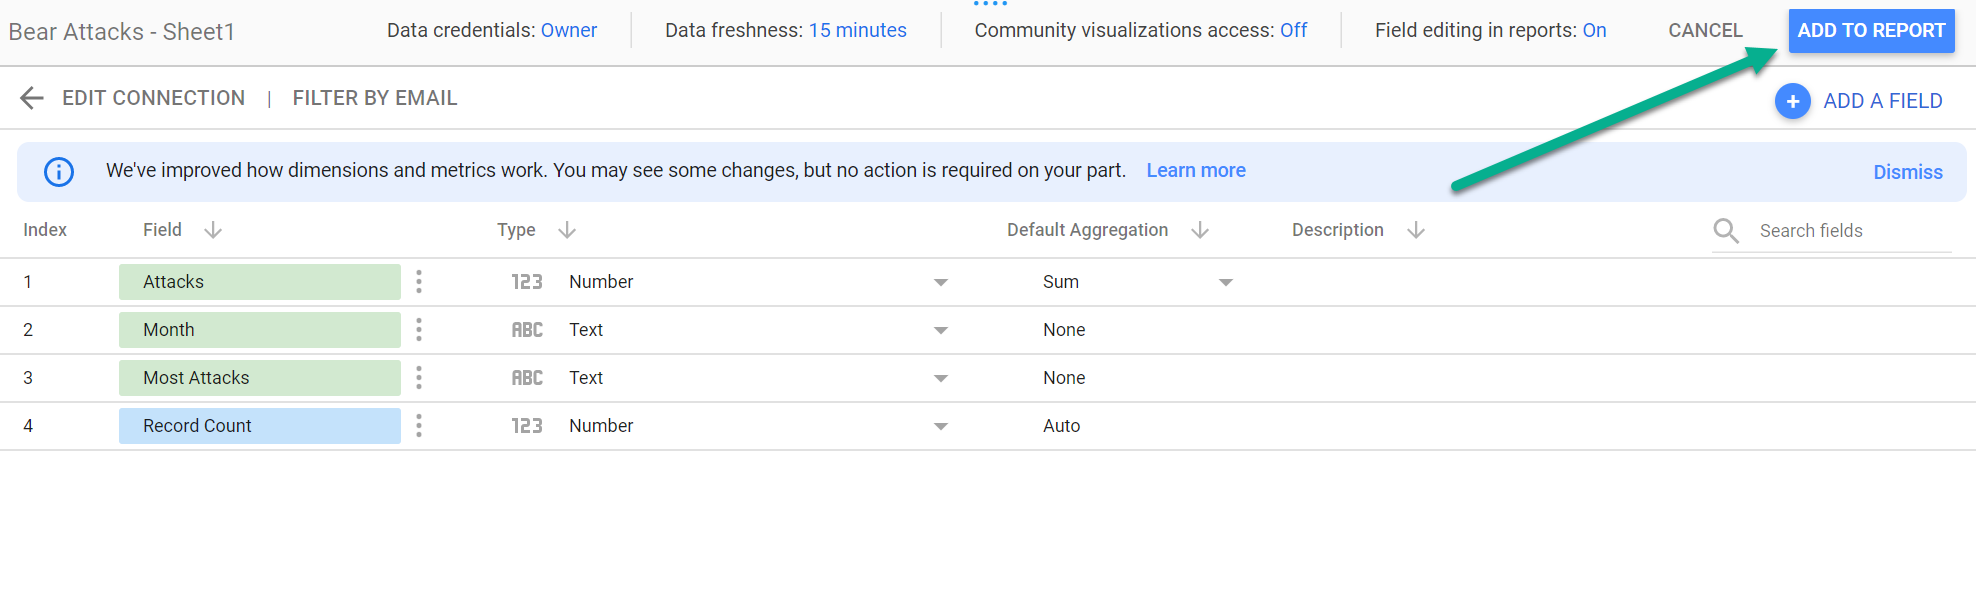
Add your Data Source to Your Report
Once you’ve connected your data source, you’ll need to add it to your report (again, top right button).
Then confirm this one more time, for some reason:
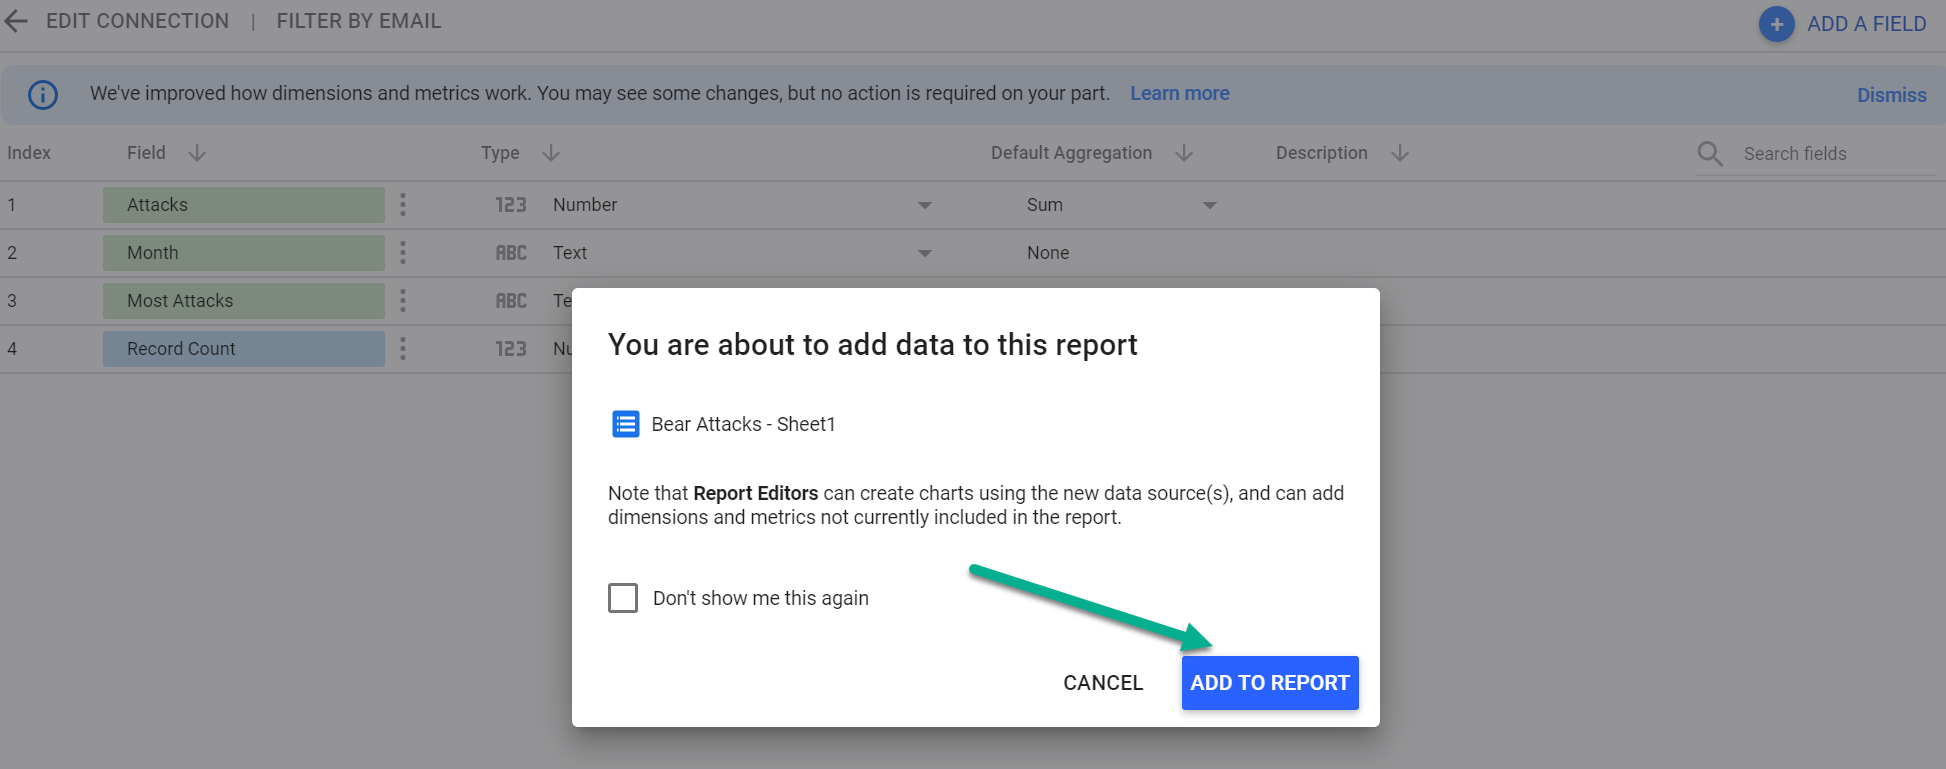
With your data source connected, you can now create charts and visualizations in Data Studio.
How to Update your Data Source in a Report:
- Data sources exist at a chart level, not a page or report level. What that means is you can have charts from different sources all on the same page.
- To change a chart’s data source, click on the chart, then in the right panel, click on the name of the data source for more options.
- You can blend data to have multiple sources in a single chart, but that’s for a more advanced tutorial.
There’s so much you can do in Google Data Studio, but it all starts with connecting a Data Source.
Paid Search Magic may receive a small commission if you make a purchase using the links on this page.